Prometheus+Grafana监控系统(01)

各组件功能:
Prometheus作为数据源,采集中心,用于收集各node节点的监控数据。
使用客户端使用node_exporter(其他的exporter)向Prometheus,或直接通过Pushgateway推送监控数据。
Grafana用于图表展示监控数据
Alertmanager用于告警。
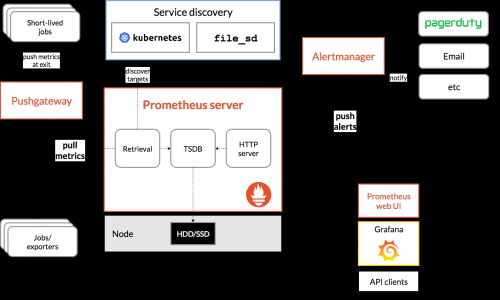
architecture.png
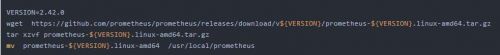
1.下载并安装二进制版本
1.1配置Systemd服务,实现开机自启动(Centos)
cat>/usr/lib/systemd/system/prometheus.service<<EOF[Unit]Description=PrometheusAfter=network.target[Service]Type=simpleUser=rootWorkingDirectory=/usr/local/prometheusExecStart=/usr/local/prometheus/prometheus --web.enable-lifecycle --config.file=/usr/local/prometheus/prometheus.yml --storage.tsdb.retention=7dRestart=on-failureLimitNOFILE=65536[Install]WantedBy=multi-user.targetEOFsystemctl daemon-reloadsystemctl enable prometheus.service && systemctl start prometheus.service
1.2配置Systemd服务,实现开机自启动(Ubuntu)
cat>/lib/systemd/system/prometheus.service<<EOF[Unit]Description=PrometheusAfter=network.target[Service]Type=simpleUser=rootWorkingDirectory=/usr/local/prometheusExecStart=/usr/local/prometheus/prometheus --web.enable-lifecycle --config.file=/usr/local/prometheus/prometheus.ymlRestart=on-failureLimitNOFILE=65536[Install]WantedBy=multi-user.targetEOFsystemctl daemon-reloadsystemctl enable prometheus.service && systemctl start prometheus.service
1.3查看工作端口9090
netstat -ntpl | grep 9090
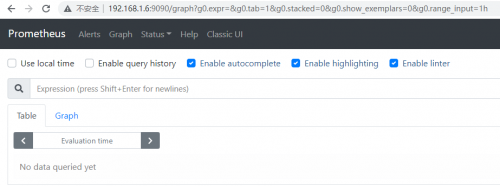
1.4web管理界面
http://x.x.x.x:9090
2.节点node_exporter 配置
node_exporter的作用是用于机器系统数据收集。
2.1下载并安装二进制版本
VERSION=1.5.0wget https://github.com/prometheus/node_exporter/releases/download/v${VERSION}/node_exporter-${VERSION}.linux-amd64.tar.gztar xzvf node_exporter-${VERSION}.linux-amd64.tar.gz mv node_exporter-${VERSION}.linux-amd64 /usr/local/node_exporter/
2.2配置Systemd服务,实现开机自启动(Centos)
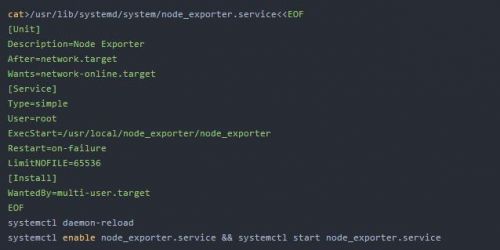
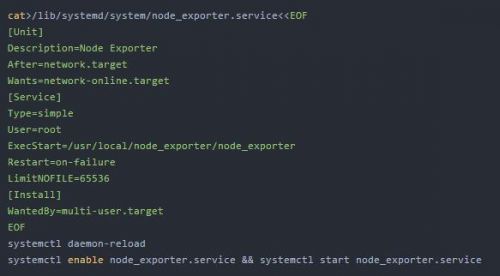
2.3配置Systemd服务,实现开机自启动(Ubuntu)
2.4查看端口

3.管理配置Prometheus信息
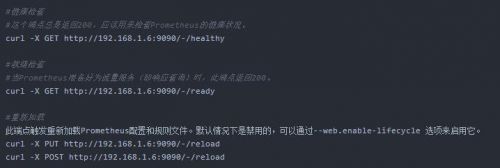
3.1Prometheus管理API
Prometheus提供了一套管理API来简化自动化和集成。
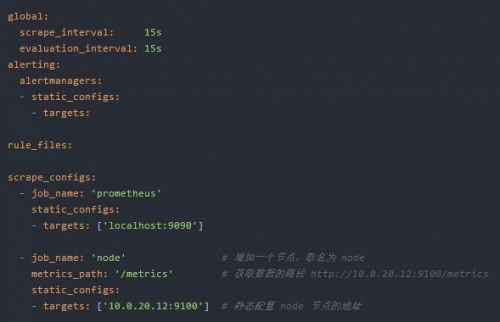
3.2prometheus自动发现--基于静态配置,添加各node节点信息
[root@es01 config]# cat prometheus.yml
##注意yaml排版格式,空2格对齐。
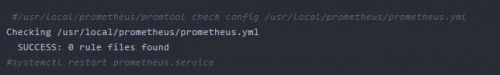
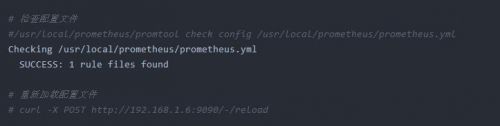
重新加载配置文件,检查配置文件,并重新加载
1检查配置文件
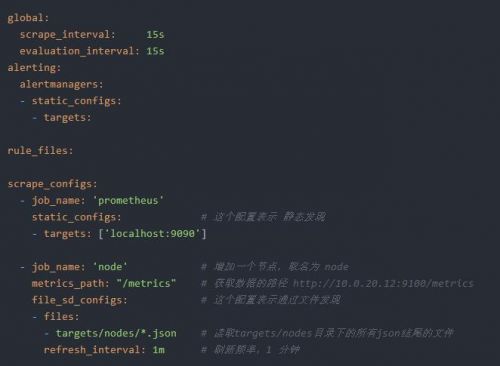
3.3prometheus自动发现--基于文件发现配置添加各node节点信息
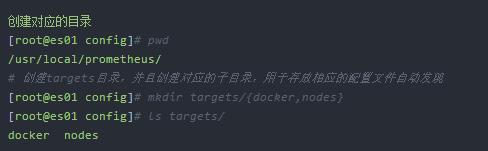
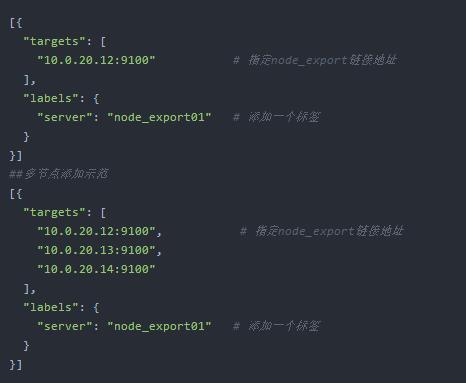
#在创建好的nodes目录下创建 nodes.json文件,并写入下面内容
[root@es01 config]# cat targets/nodes/nodes.json
修改配置文件prometheus.yml如下:
检查,重新加载配置文件
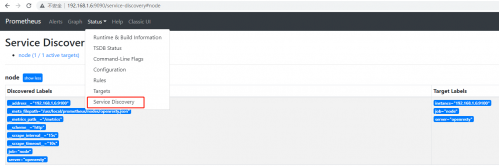
进入http://192.168.1.6:9090,查看添加到的主机
3.4简单总结:
定义好对应的主配置文件prometheus.yml后,后续要添加新的node节点监控进来,只需要增加node.json内容即可,也不需要重载prometheus服务,相对比较简单的基于文件的自动发现。
4.使用grafana展示监控效果
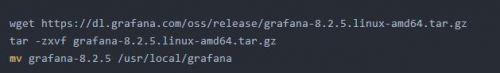
4.1安装grafana
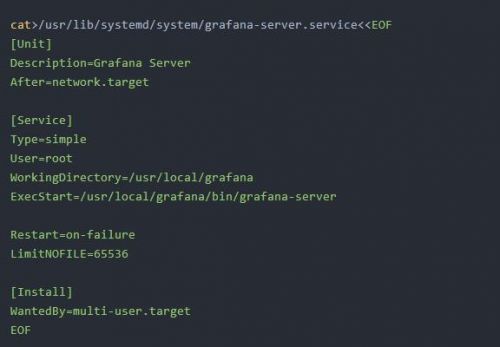
4.2创建Systemd服务
4.3服务开机自启

/usr/local/grafana/conf/defaults.ini为默认配置文件
工作端口,默认为3000,web管理页面http://x.x.x.x:3000
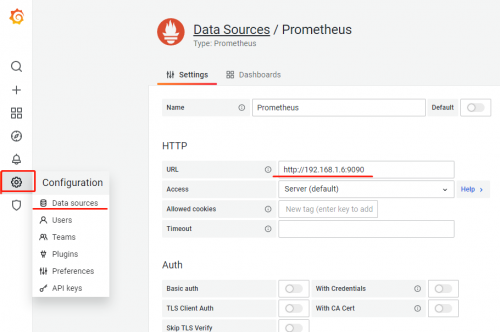
4.4添加prometheus数据源,生成可视化图表
登录web管理页面,添加数据源
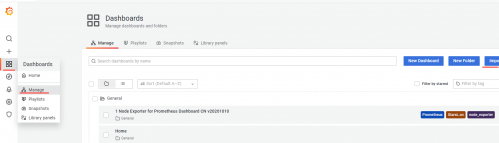
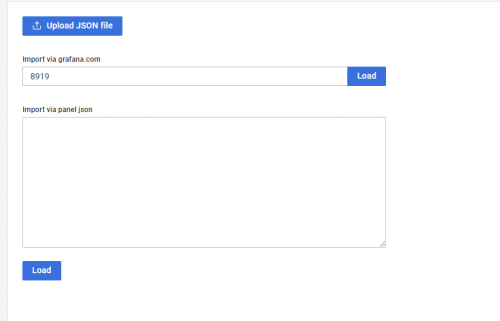
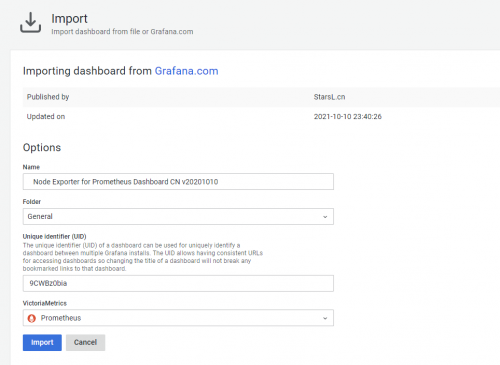
为prometheus数据源添加可视化面板
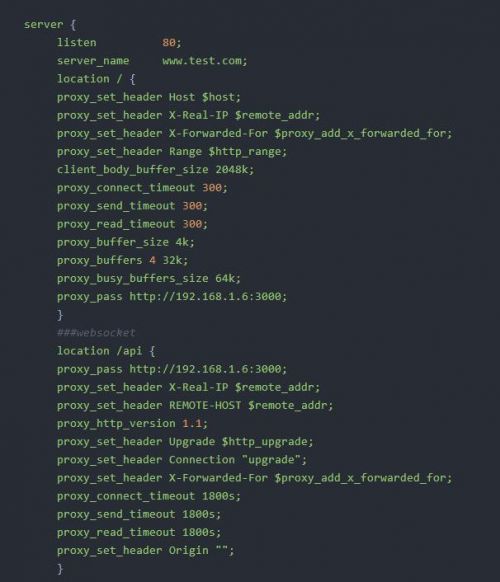
4.5在nginx上为grafana配置反向代理
nginx为grafana进行反代时,需要配置websocket跨域反向代理